
Star Valley Market Report
Year End | 2025


Meet Keller Williams
Jackson Hole
As leaders in luxury, we are excited to share our key insights that make us unique—from educating on the market to empowering our clients to make informed decisions when the time is right. We pride ourselves on our ability to move you from where you are now, to where you want to be. We are your locally owned brokerage in Jackson and beyond.
Market Overview
End of Year | 2025
Year over year, overall transaction activity softened, with total sales declining 7% (from 437 to 407 closings). While fewer properties changed hands, pricing metrics tell a different story — values continued to strengthen. The average sale price rose 5% to $561,985, and the median price increased 4%, signaling sustained upward price pressure and continued buyer willingness to pay for quality inventory.
Despite the drop in unit sales, total dollar volume only slipped 2% to $228,727,890. This relatively modest decline, compared to the reduction in sales count, underscores the resilience of property values and suggests the market is adjusting in pace rather than in price.
Inventory levels expanded meaningfully. Active listings increased 20%, providing buyers with more options and reducing the intensity seen in previous low-inventory cycles. Pending sales climbed 33%, a notable indicator that demand remains active and engaged, even if transactions are taking longer to close.
Average days on market rose 9% to 164 days, reflecting a more normalized absorption pace. Homes are still selling, but buyers are exercising greater selectivity, and properly priced, well-presented properties are outperforming.
The significant shifts in the highest and lowest recorded sale prices appear to be influenced by outlier transactions in 2024 rather than representing a broad change in market fundamentals. When those extremes are normalized, the core market trend remains steady: fewer sales, stable-to-rising values, expanding inventory, and a gradual shift toward a more balanced environment.
Overall, the data suggests a market transitioning from rapid acceleration to sustainable growth — with pricing stability supported by consistent underlying demand.

Sales were down about 7% year over year, but prices actually strengthened— average up 5% and median up 4%. Inventory and pendings are up, homes are taking a little longer to sell, which tells me the market is simply normalizing. The big highs and lows last year were mostly outlier deals, not a major shift in the overall market.
Data sourced from the Teton Board of REALTORS(R) MLS. Statistics compiled for the reporting period and are deemed reliable but not guaranteed.
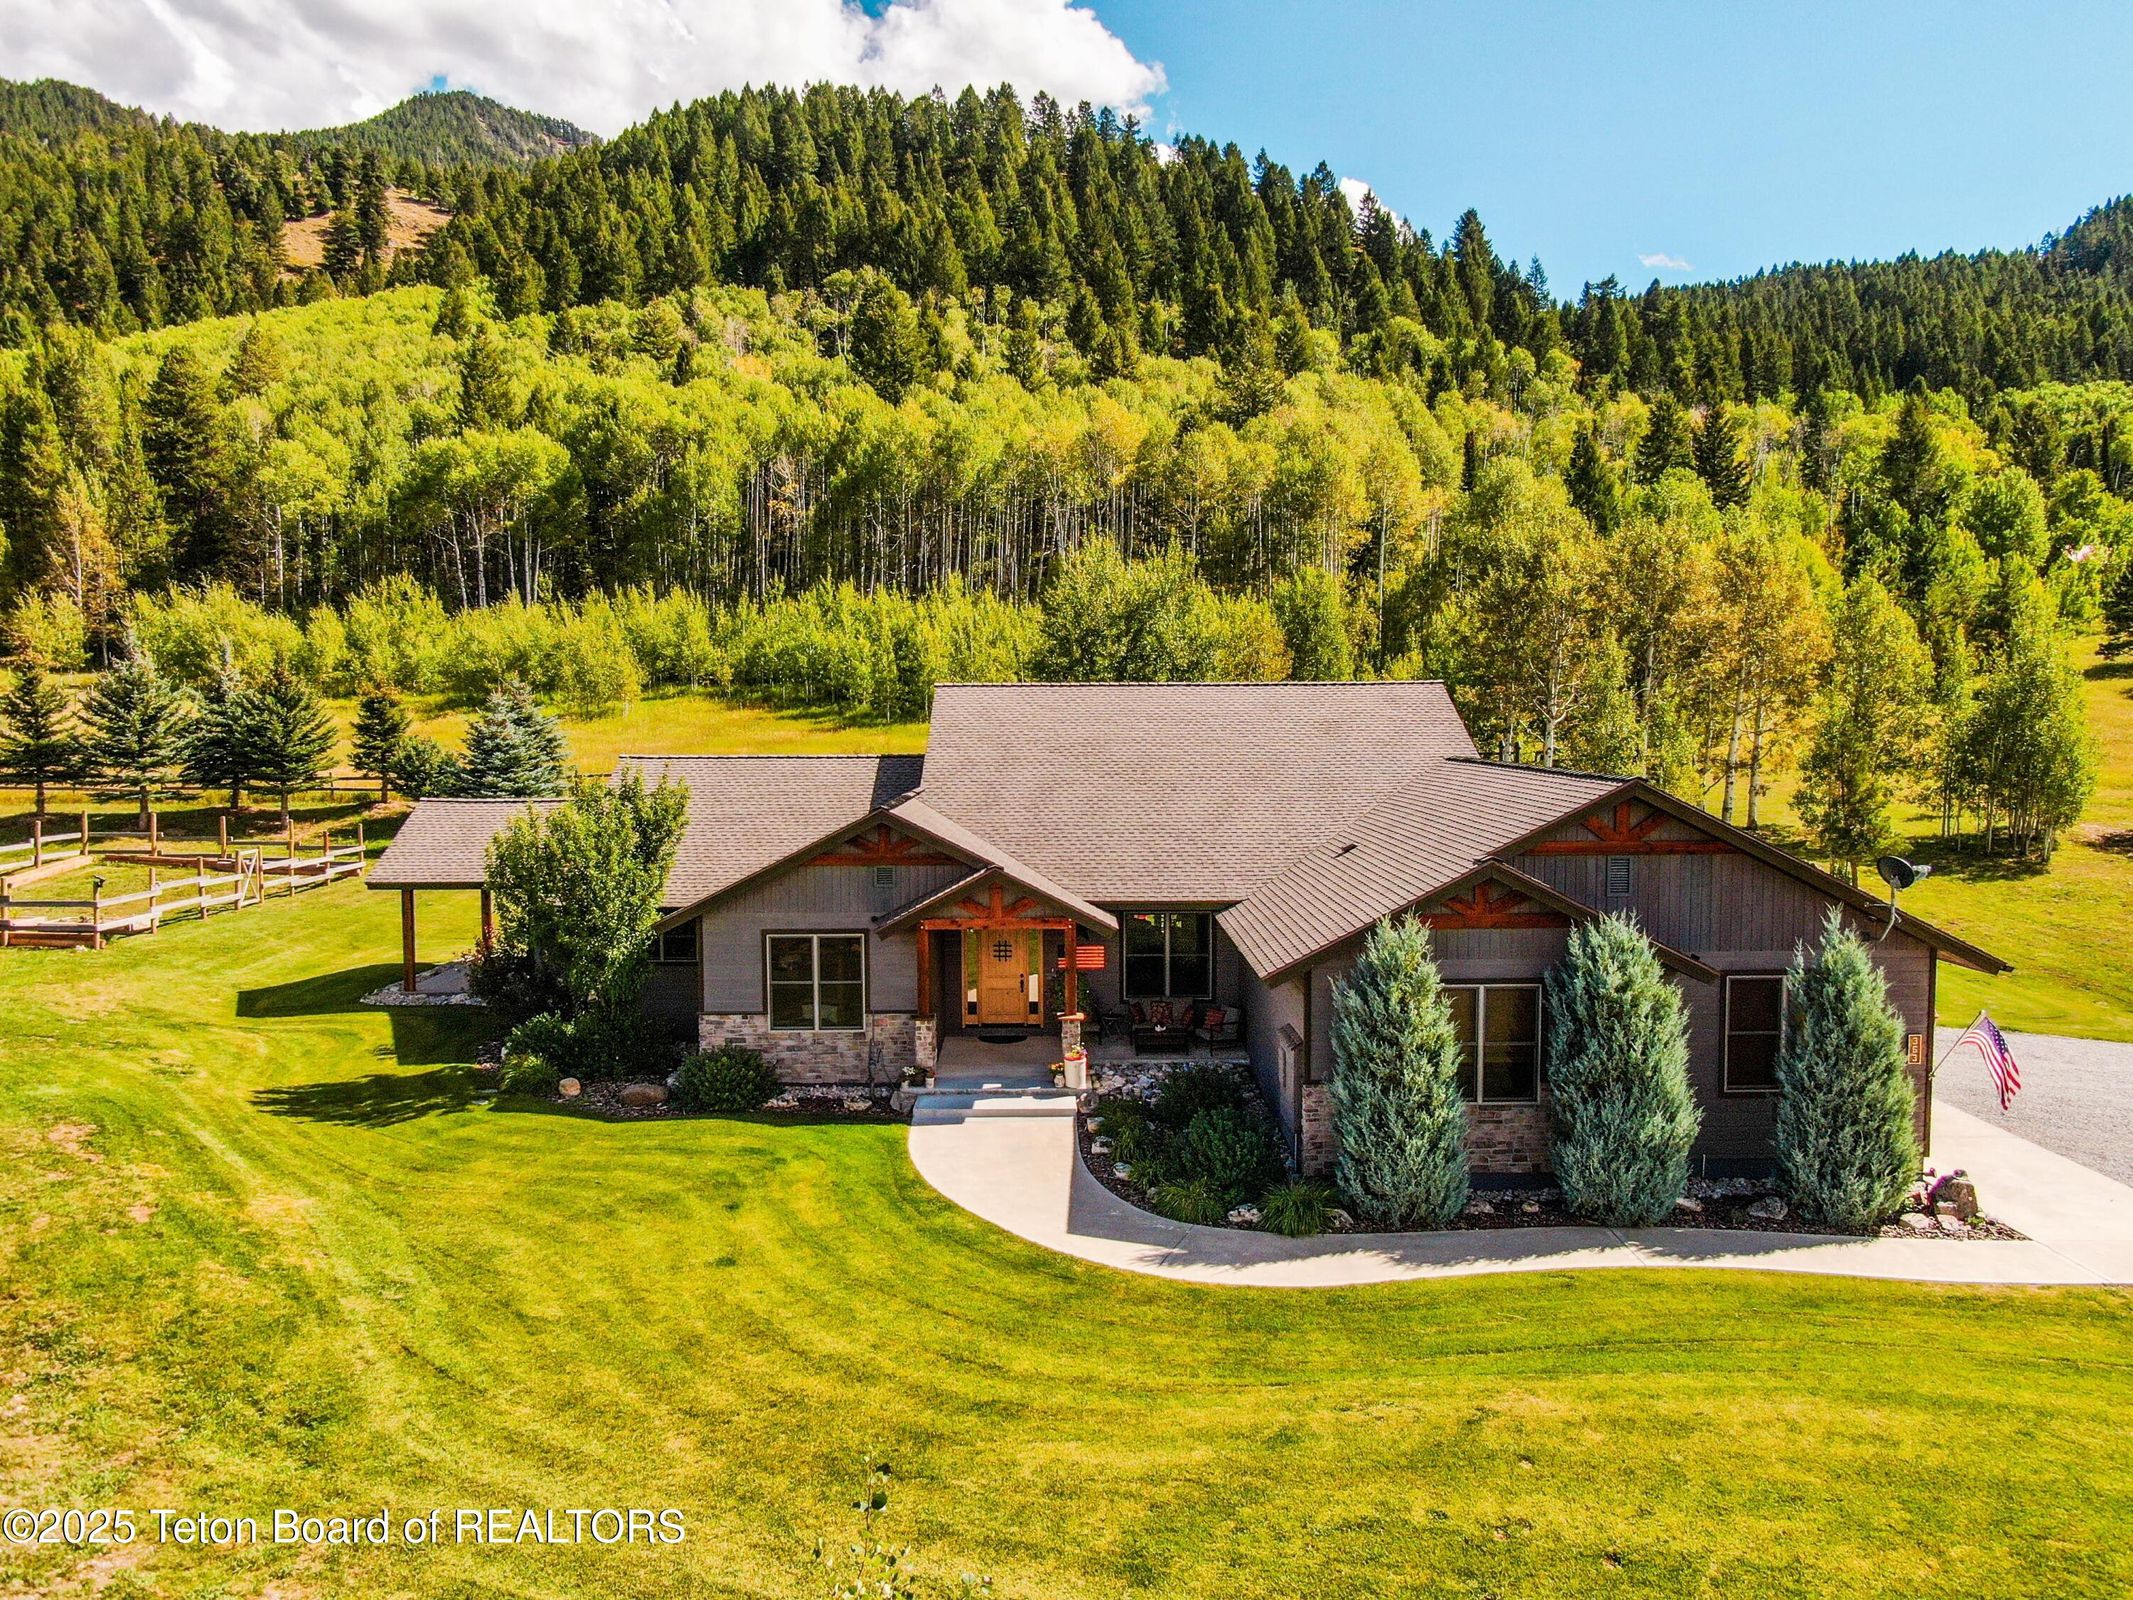
Residential sales were essentially unchanged year over year, moving from 215 to 216 transactions, indicating steady buyer demand despite broader market shifts. Pricing remained relatively stable overall. The average sale price increased 1%to $861,008, suggesting values are holding firm. However, the median price declined 4%, which points to a change in the composition of sales — with a slightly higher concentration of mid-range or lower price-point properties closing compared to the prior year.
Total dollar volume rose 2%, reflecting the market’s overall resilience and continued capital flow into residential real estate. At the same time, market pace slowed. Average days on market increased 20% to 145 days, signaling that buyers are taking more time, being more selective, and negotiating more carefully than in previous cycles.
The highest recorded sale price was lower than the prior year, which appears to be driven by fewer ultra-luxury transactions compared to 2024 rather than a broad-based softening in values.
Overall, the data suggests a stable but more measured residential market, with steady demand, modest price movement, and a shift toward a more balanced, normalized selling environment.

Sales were essentially flat year over year, and prices are holding steady overall. The slight dip in median just reflects more mid-range homes selling. Homes are taking longer to move, which tells me we’re in a more balanced, normalized market— not a declining one.
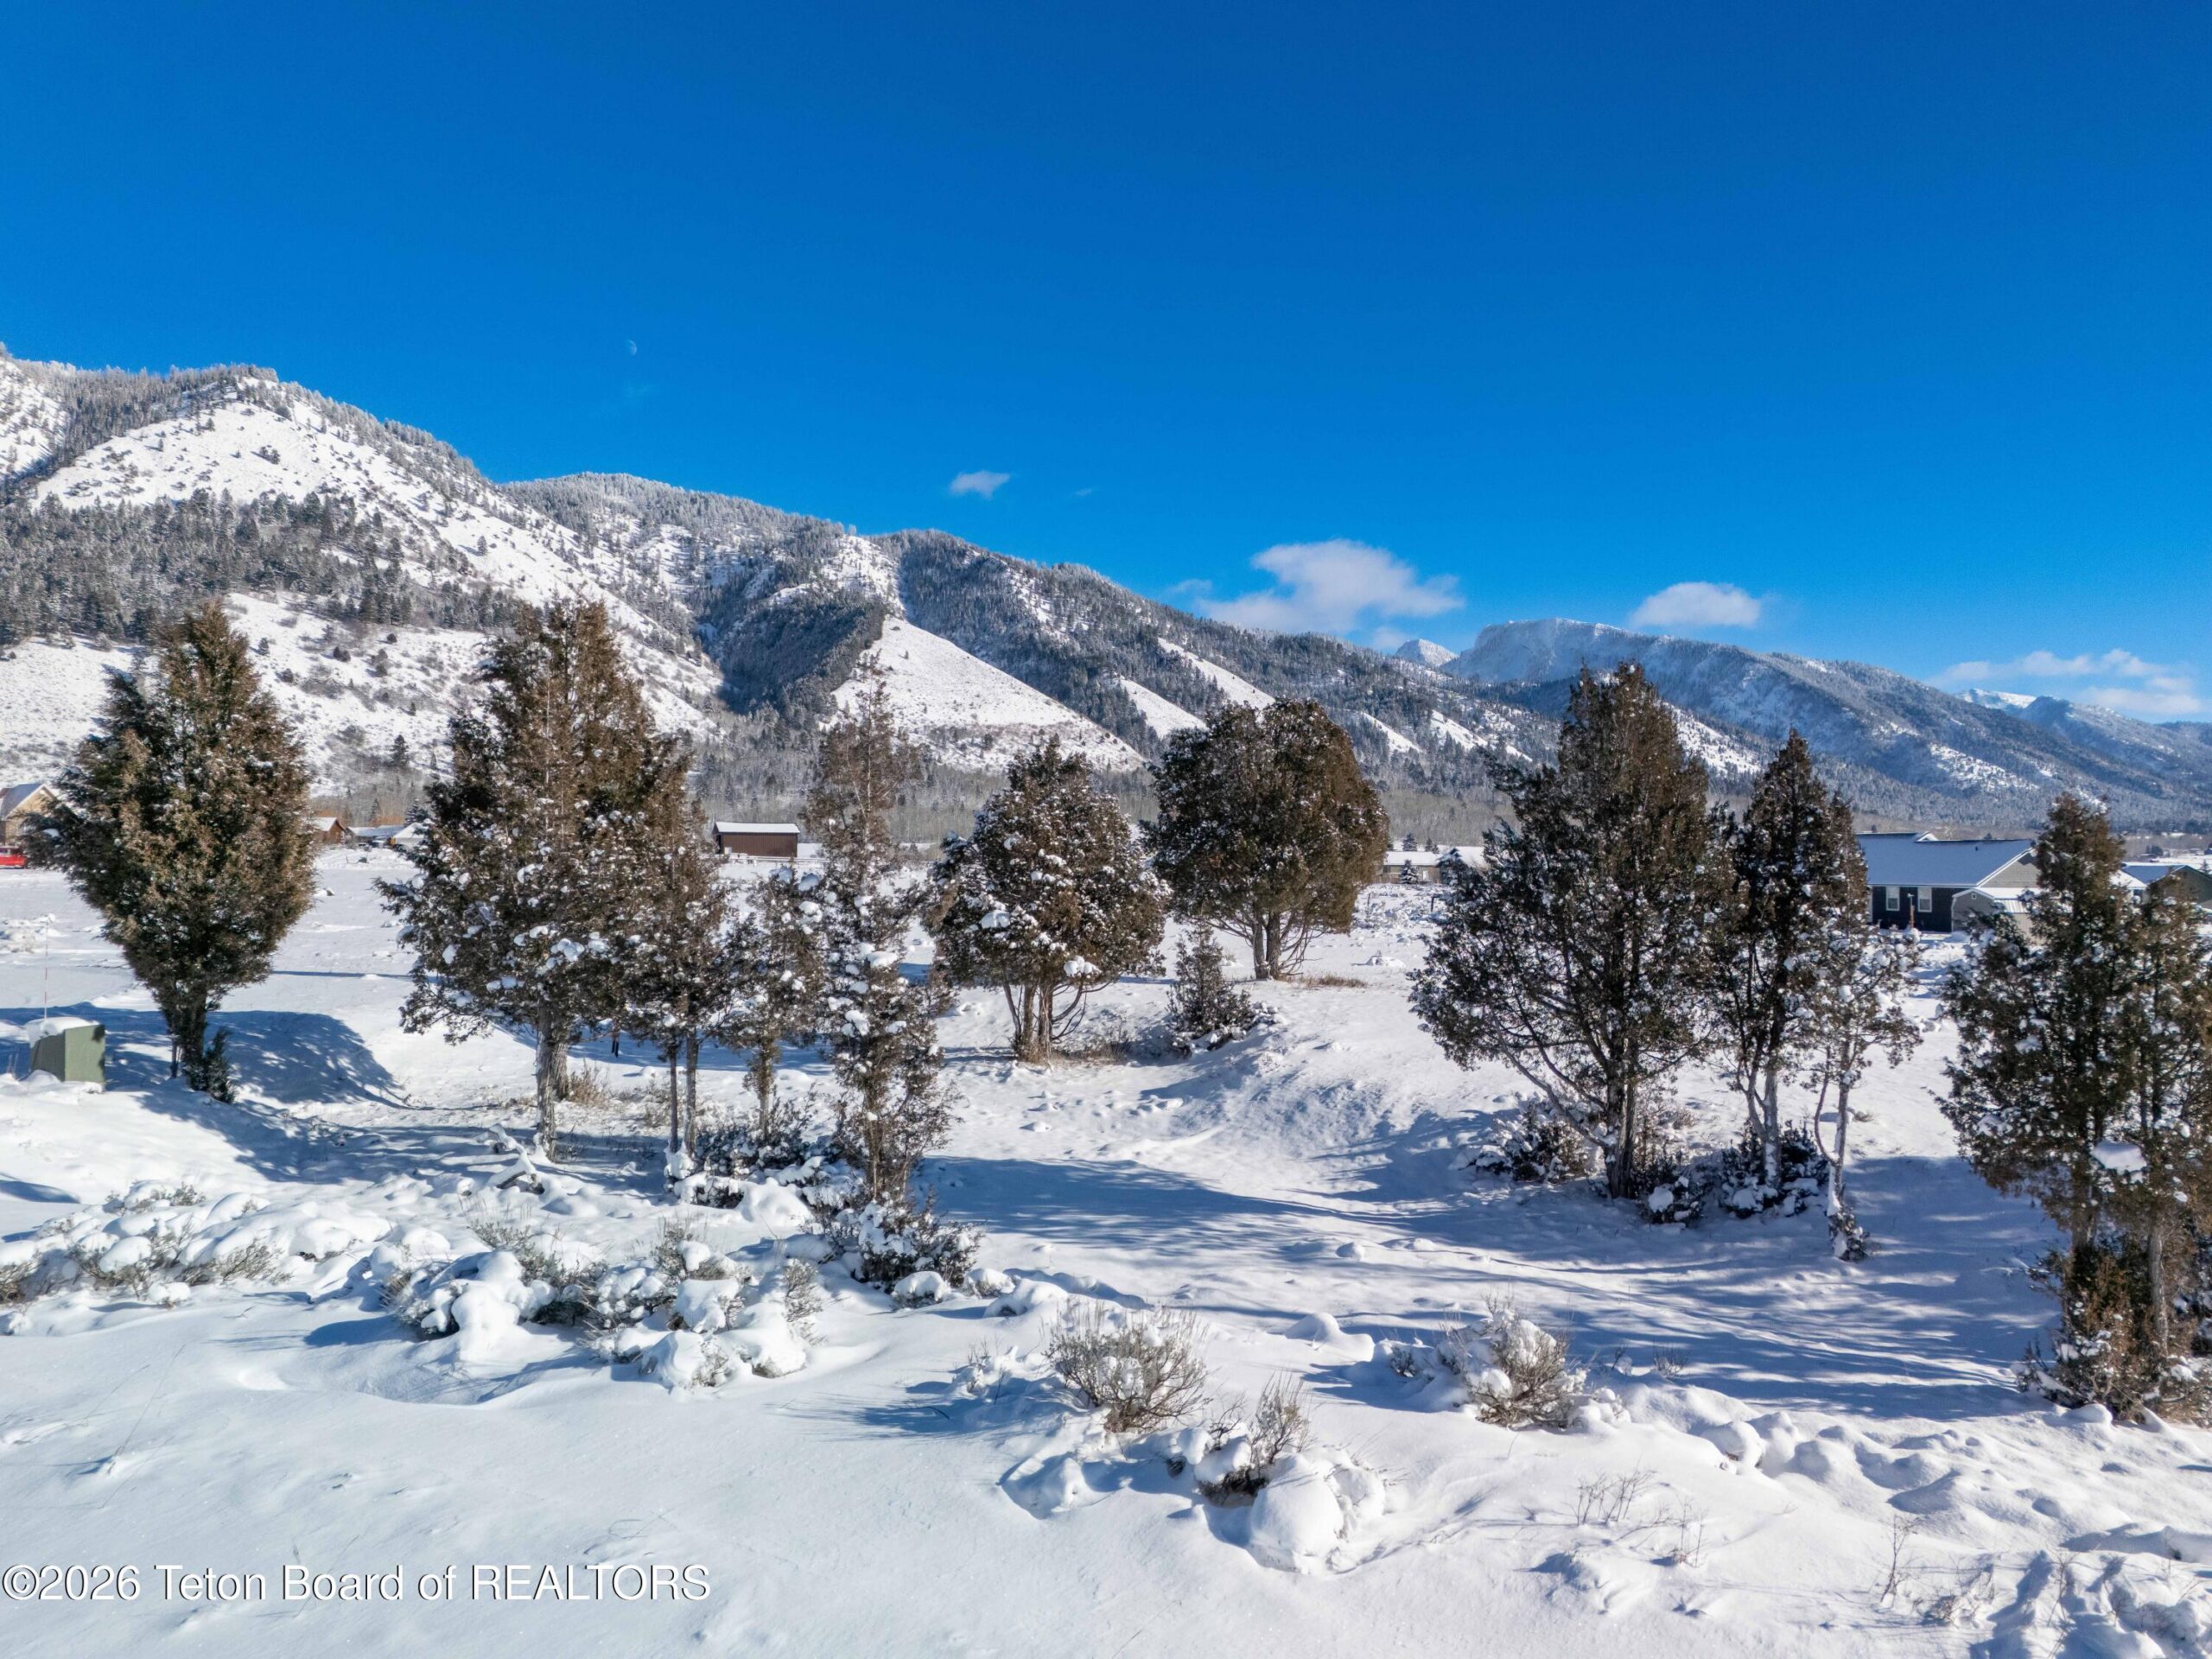
The vacant land segment showed the most noticeable softening year over year. Total sales declined 15%, signaling a pullback in buyer activity compared to the previous year. Pricing also adjusted modestly, with the average sale price down 3% and the median price down 6%, suggesting slight price compression — particularly in mid-range parcels.
Total dollar volume dropped 18%, reflecting the combined impact of fewer transactions and softer pricing. At the same time, average days on market increased 4% to 183 days, indicating land is taking longer to sell as buyers move more cautiously and evaluate opportunities more carefully.
The marked decline in both the highest and lowest recorded sale prices points to the likelihood that 2024 included several larger or atypical land transactions that did not recur in 2025.
Overall, the land market appears to be recalibrating after stronger prior-year activity, with more selective demand and a slower pace of absorption.

Vacant land saw the most softening this year — sales were down about 15% and prices eased slightly. It’s taking a bit longer to sell, and last year’s big high-end deals didn’t repeat. Overall, it feels more like a market recalibrating than a major downturn.
The Full Report
Turn through the complete End of Year | 2025 edition.
Methodology & Data Sources
All data in this report is sourced from the Teton Board of REALTORS(R) Multiple Listing Service (MLS). Statistics are deemed reliable but not guaranteed. Transaction counts and dollar volumes include closings recorded within the reporting region. Off-market transactions, FSBO sales, and transactions recorded outside the MLS are not included.
Never Miss a Report
Subscribe for quarterly market intelligence — original analysis delivered to your inbox from the team that knows this valley best.